Surprising Optimization When Appending Elements to an Array in ZSH

Recently I ran into a surprising ZSH performance bottleneck while editing my .zshrc. Because it gets loaded every time a new shell comes up, I have noticed the issue pretty fast. I quickly started digging into the problem. Apparently, this surprising behavior concerns appending new elements to an array. I did not have a huge file that I was trying to read, only about 6000 elements or so. But still, it had a significant impact on how fast the Z shell was able to start up.

Imagine a simple loop such as this:

#!/bin/zsh
while read line; do
  echo "${line}"
done < ~/somefile

And ~/somefile has been prepared with:

#!/bin/zsh
for i in `seq 1 8873`; do
    UUID=$(cat /dev/urandom | tr -dc 'a-zA-Z0-9' | fold -w 32 | head -n 1)
    echo "${UUID}" >> ~/somefile
done

Then, let’s read the same file into an array with two different scripts:

#!/bin/zsh
arr=()
while read line; do
    arr=(${arr} ${line})
done < ~/somefile
#!/bin/zsh
arr=()
while read line; do
    arr+=(${line})
done <~/somefile

Could you guess which one is faster? If your answer is the 2nd one then you are correct. At least on my machine:

$ time ~/testcase_fast.sh
~/testcase_fast.sh  0,17s user 0,11s system 98% cpu 0,279 total
$ time ~/testcase.sh
~/testcase.sh  15,68s user 0,95s system 98% cpu 16,881 total

A simple ltrace(1) comparison reveals where the time is actually spent:

% time     seconds  usecs/call     calls      function
------ ----------- ----------- --------- --------------------
 34.49   17.657872          60    292810 read  
 25.07   12.833696          43    292815 mbrtowc
  8.41    4.304812          60     71076 sigprocmask
  7.80    3.994101          43     91362 strlen     
  6.99    3.580468          43     82299 strcpy
  4.04    2.066031          43     47979 malloc
  3.78    1.936972          42     45209 free
...

And the “slow” version (not the full run here since it takes a very long time however the picture is clear):

% time     seconds  usecs/call     calls      function
------ ----------- ----------- --------- --------------------
 28.21  177.575768          44   4006596 strlen     
 28.11  176.938217          44   4000420 strcpy
 14.16   89.127826          44   2002599 malloc
 14.01   88.177566          44   1996322 strchr
 13.99   88.058532          44   1999451 free  
  0.62    3.915208          59     65835 read   
  0.45    2.844029          43     65841 mbrtowc  
...

My original assumption was that ZSH would “understand” that I am simply adding a new element at the end and thus avoid copying. To be honest, I haven’t even suspected this part when I had started investigating this. However, clearly, that’s the culprit. It seems that in the slow version the Z shell is constantly allocating, copying, and freeing memory which takes most of the time – more than 50% of the time. 😱

Truth be told, I have copied this code at first from StackOverflow and adapted it to my own needs:

https://stackoverflow.com/questions/54309712/zsh-doesnt-autocomplete-correctly-my-ssh-command

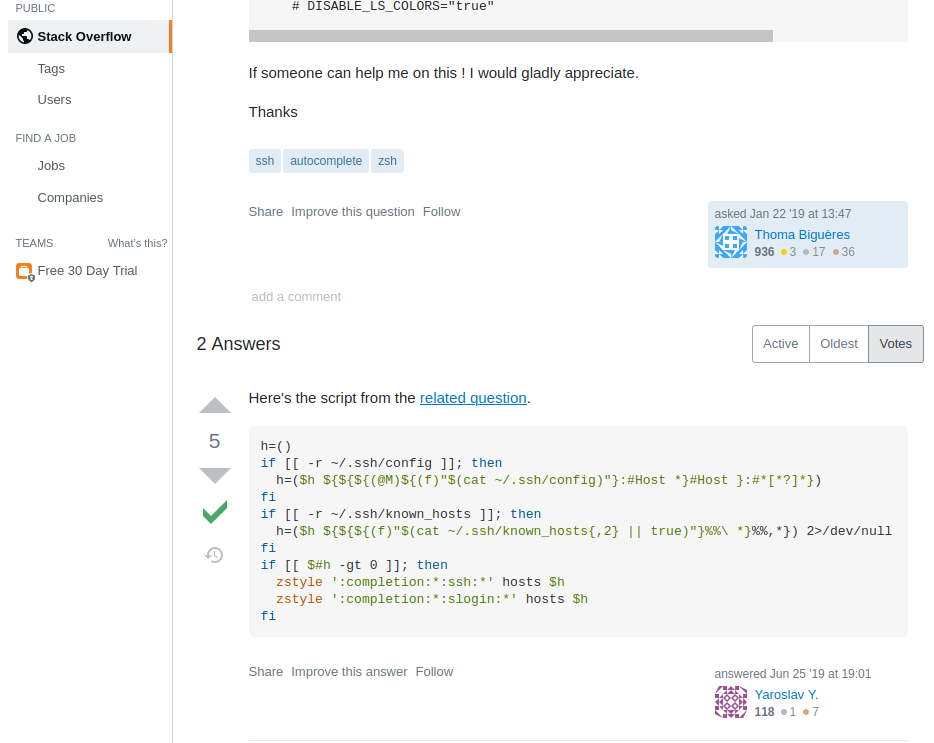
So, this is yet another reminder not to have too many presumptions about how something works and that snippets of code on the Internet are not necessarily of the best quality.

Strictly speaking, we couldn’t probably even say that we are appending an array in the slower version because the += operator is not being used. On the other hand, the effect is the same so I think it is OK to use the word append here in the general sense.

All in all, you should always use += when appending elements to an array! I hope this helps! Let me know if you have any comments or suggestions!

How to solve puppetdb and SIGKILL problems

In this post, I wanted to share some knowledge that I have gained recently. Sometimes your Puppet server might start returning 500 HTTP status codes. You should check puppetserver‘s logs first of all, of course, but another thing to check is the puppetdb. puppetdb is the component which is responsible for storing Puppet-related data. In this case, there were memory-related problems on the puppetdb instance. The puppetdb logs in this case have looked like this:

Apr 02 15:25:19 hostname systemd[1]: Started puppetdb Service.
Apr 04 18:54:07 hostname systemd[1]: puppetdb.service: main process exited, code=killed, status=9/KILL
Apr 04 18:54:07 hostname systemd[1]: Unit puppetdb.service entered failed state.
Apr 04 18:54:07 hostname systemd[1]: puppetdb.service failed.
Apr 04 18:54:08 hostname systemd[1]: puppetdb.service holdoff time over, scheduling restart.
Apr 04 18:54:08 hostname systemd[1]: Stopped puppetdb Service.
Apr 04 18:54:08 hostname systemd[1]: Starting puppetdb Service...

The regular logs in /var/log/puppetlabs/puppetdb/puppetdb.log also did not show any particular problems on why it could have been killed by that signal. So, what could have been the issue?

It turns out that the Java’s virtual machine supports some interesting parameters. One of them is -XX:OnOutOfMemoryError. With that, you can specify what kind of command should be executed once the JVM runs out of memory. In this case, it was set to -XX:OnOutOfMemoryError=kill -9 %p. It means that SIGKILL (9) is sent to the JVM process if it runs out of memory.

A quick GitHub search shows that it is a pretty prevalent thing to do. However, the problem with it is that it is relatively trivial to do a denial-of-service attack because there is no graceful load shedding. It only takes sending a bunch of requests to it that would allocate some memory. That is it if there is no queuing mechanism in place. Also, it provides no way of knowing where all of the memory was allocated when it runs into such a situation. Plus, the state could get so bad that it might be impossible to spawn a new process that would send that signal. So, it should be avoided. But, hey, at least systemd conveniently shows that the process has been turned off with SIGKILL (9) in this scenario.

Obviously, when this happens then you should adjust the -Xmx and -Xms parameters on your JVM process to permit it to allocate more memory. Of course, it is only possible if there is enough memory available.

Looking into the past it seems that this has appeared in puppetdb with this commit. As far as I can tell, this has been added because old JVM versions (pre-2016) have not supported any other way of dealing with this situation besides adding a huge try/catch block & dealing with all of the possible situations or just crashing out. Plus, the exception could even appear in a separate thread that is not under our control so it requires a lot of extra effort for not much gain.

But, since 2016 new, better ways of dealing with this situation have been introduced. Consider using +XX:ExitOnOutOfMemoryError or +XX:CrashOnOutOfMemoryError as per these release notes if your JVM is new enough. They avoid some of the problems mentioned earlier such as being unable to start another process. It is worth mentioning that other users of that flag such as prestodb are slowly moving towards the new ones with commits such as this.

In general, it is probably best to enable options such as -XX:+HeapDumpOnOutOfMemoryError or -XX:HeapDumpPath if you have enough spare space on your servers where JVM processes are running.

This has also reminded me of a great article on LWN about crash-only software. Perhaps it is really easier to just crash and quickly restart if something goes wrong? But at the very least the software should print some diagnostic messages before destroying itself to help its users understand what is going on in situations like these.