Choosing Maximum Concurrent Queries in Prometheus Smartly

The popular monitoring software Prometheus has recently introduced (from 2.6) new knobs which regulate how many queries can be executed concurrently.

Prometheus logo from Wikipedia
Prometheus logo

There are even the same knobs for different interfaces. Here they are with their default values:

  • –storage.remote.read-concurrent-limit=10
  • –query.max-concurrency=20

The latter is an upper-bound value to the former option. However, the question is:

How do you choose sensible values for them?

Well, I think I have the answer.

The number should be picked such that it does not exceed the number of threads of execution on your (virtual) machine. Ideally, it should be a bit lower because if your machine will encounter huge queries, it is (probably) going to also use the CPU for other operations such as sending the packets over a network.

I recently noticed empirically that executing a “huge” (let’s not delve into the definition here) query makes my Prometheus Docker container start using just a bit more than 100% of the CPU. This gave me an idea for this blog post.

Go has a concept called goroutines which are light-weight threads that are run later on “real” threads. Also, a single goroutine is an indivisible unit of work that can be scheduled only on one thread of execution at any time.  So, the question becomes: is more than one goroutine spawned during the parsing of a query?

Let’s delve into the code. We will go bottom-up: we are going to work our way upwards. Sorry if I will miss some kind of detail – you can find all of the exact information in the source code.

Prometheus has a type v1.API which handles the HTTP calls. The api.queryRange function gets spawned in a fresh, new goroutine which handles the request and returns the result. The API type itself has a member called QueryEngine which handles the lifetime of queries from the beginning till the end, and it is connected to a querier which queries the underlying TSDB.

In that function, a new range query using that querying engine is created with NewRangeQuery and then the Exec method is called on it which actually does the query. A context is passed to it which is used to limit the amount of time that it can take to perform the query.

For better or worse, the Prometheus code has a lot of types. Thus, to avoid blowing this post out of proportion and just copying, and pasting the source code, I will sum things up.

It trickles down to selecting blocks according to the specified time range. Then the blocks which are in that range are iterated over and a NewBlockQuerier is created, and then they are joined into a bigger querier which is returned for evaluating the expression that was passed. For the write-ahead-log, a segments querier is created which handles the queries that touch the WAL.

With remote read, it is a bit different. That mechanism employs what is called a fanout type which implements the queryable interface. In essence, it sends those queries to other Prometheus instances and merges them. Here, it may be that more goroutines are spawned but they are not performing much of active work – only sending a query and waiting for a result – thus we will not count them. The same principle of passing a context everywhere is used which limits the amount of time it can take.

The comment in prometheus/tsdb/db.go:801says:

// Querier returns a new querier over the data partition for the given time range.
// A goroutine must not handle more than one open Querier.
So, a single goroutine cannot have more than one Querier. It more or less answers the original question but just for the sake of clearness, let’s see how all the top-level types are connected.
The main type DB has a member of type Head which consequently has a member of type *wal.WAL (new data that was persisted on the disk) and *stripeSeries (new data that is still on RAM with some optimizations to avoid more lock contention).
Here is how the type architecture looks like:
Picture showing the relation by the types DB, Head, *wal.WAL, and *stripeSeries
Type architecture
Because TSDB is append-only, the queries can be executed concurrently without locking the series data which is already on disk because they cannot change if the compaction is off, and if certain methods like 
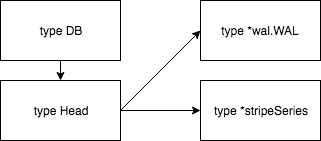
Delete() are not called. Clever usage of RWMutex permits for it to work that way.
If the compaction is on, the blocks are being regularly compacted in a separate goroutine and reloaded which is seamless. Also, all of the blocks types guarantee atomicity per-block so that case is protected against race conditions as well and it only takes the minimal amount of locks.
All in all, we have just seen that Prometheus is really trying hard to avoid locking as much as possible, and TSDB queriers execute in the same goroutine’s context of their users. This means that the maximum amount of concurrently permitted queries should not exceed the number of threads of execution of the CPU, and ideally, it should be even a bit lower because some work has to be performed for adding new data – scraping, parsing, committing the new metrics.
If in doubt, please always evaluate what are the current latencies of queries coming into your Prometheus machines, and check if they have decreased or increased after making the changes. You could create a nice Grafana dashboard for that. Obviously, revert the changes if they had not helped you but I am pretty sure that they will if you are, for example, using the default limits and your CPU has many more cores than 20.

Apply The Same Principle to Monitoring Alerts as to Software Bugs

It is almost a mantra in the quality assurance world to always add a test case to your unit, integration, or any other tests whenever you find a new error in your software product which checks for exactly that case. Over time I have noticed that the same principle should be applied to monitoring.

Consider adding new alerting rules whenever you run into anomalous behavior and afterward you see the metrics which have indicated it. Treat it as if they are tests but they are “real-time” tests which provide not just more confidence in your software but also more transparency. After all, all tests do not show that there are no bugs in your program but that at least those defined use cases work:

After a while (and I am talking about only a few months of evolution) you will have a collection of tests which do, in fact, prove the absence of many bugs. Not all of course, but any relevant ones will be covered. — DonWells

It would be nice if we could add all of those alerting rules at the beginning but unfortunately, that is not possible because the connections between different metrics increase exponentially just like the different number of states that your program might have. However, not all is lost because we can at least add “simple” alerting rules which clearly show that something wrong is going on e.g. the amount of responses with HTTP code 500 has increased over the last 5 minutes.

It seems to me that in the future we might get that kind of alerting rules together with the software. One caveat is that the syntax of the alerting rules is different for almost each monitoring system. Hopefully, something like OpenMetrics project will be able to change the status quo. After all, metrics are just floating point values with timestamps and labels (a hash map of string pairs) attached to them. It should not be hard to invent a new, platform-agnostic syntax for these things.

Looks like that is already happening bit by bit. Developers and users are starting to use things like jsonnet to automate the generation of alerting rules, dashboards. For example, there is an initiative called “mix-ins” which are essentially small archived packages with jsonnet scripts and their supporting libraries so that you could install a “mix-in” for your software. However, it is still in beta but the future is looking bright.