Intro
There are two different schools of thought when thinking about how metrics are ingested into a monitoring system: either the metrics get pushed (usually via UDP) into the system or they get pulled (usually via HTTP). I might not mention that I have that in mind when saying “push or pull based systems” in some places to keep the article terse.
The push method is used in systems such as Graphite whereas the pull method is used by monitoring systems like Prometheus.
Which one is better? Just like with everything in life – there is no clear-cut answer and both sides have very strong arguments in favor of them. I will try to look through them.
It will mostly be a rehash of the arguments that I have presented in the Kaunas University of Technology when I have introduced the Prometheus monitoring system.
Arguments
In Favor Of Pull: Easier To Control The Authenticity and Amount of Data
When pulling the data we can be sure of the authenticity of the data since the server itself is which initiates the connection. I think that it makes the data path much clearer since most of the users nowadays have routers behind their public IP addresses and we might get mistaken easily about as to whether the data actually came from.
Let me try to clarify this point. With TCP pull-based systems, the metrics need to be directly accessible i.e. the port on which metrics data is available is always listening, whereas in a push-based system temporary connections are used which disappear and appear very swiftly.

Also, it makes it easier to plan the capacity of pull-based systems since the exact targets from which metric data will be gathered is known in advance. On the other hand, on push-based systems, any kind of system can push to the metric gathering server. This could be fixed by using a whitelist of servers from which to accept data but most push-based systems do not support that. Plus, we are considering the characteristics of two different models and not their implementations.
In Favor Of Push: Easier To Implement Replication To Different Ingestion Points
Since it is all initiated by the client itself it becomes easier to replicate the same traffic to different servers. You just need to transmit it to more than one target IP address.
One of the most popular monitoring systems, Graphite, that is based on pushing has this on their website:
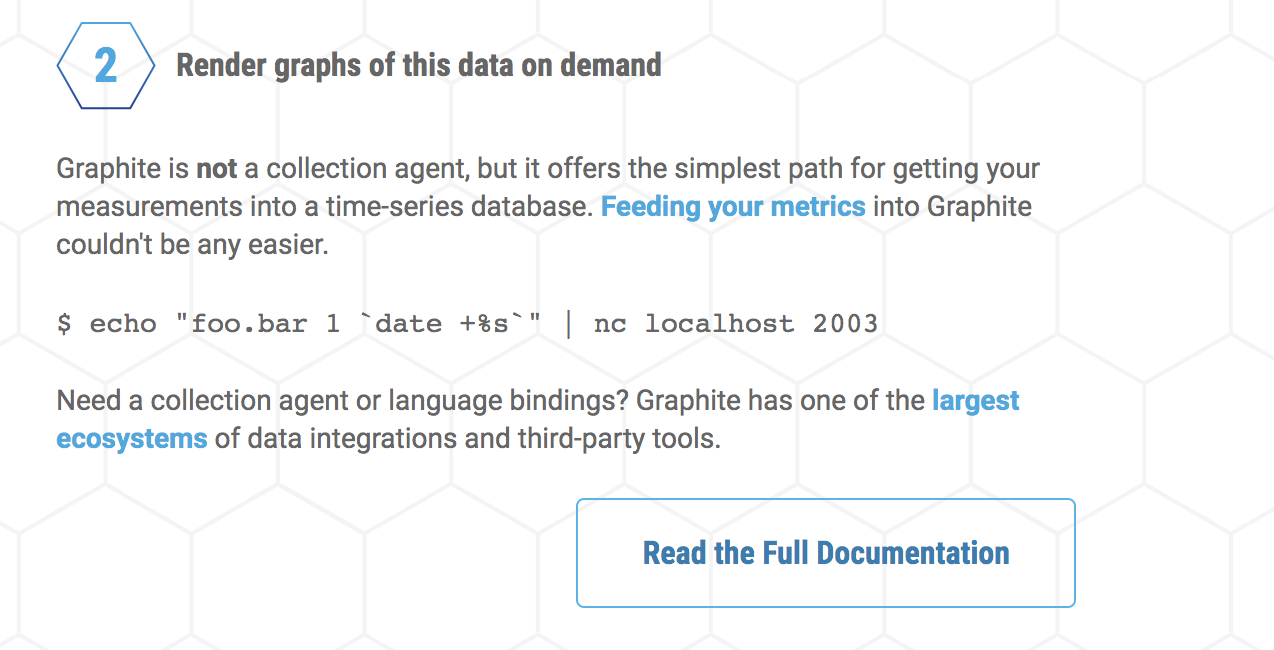
One of its components – Carbon – has things such as a replication factor, relay method, and so on, which makes it easy to start doing such a thing. It is really much easier to do that instead of standing up another instance of, for example, Prometheus.
Also, consider the fact that all of the receivers will get the same exact data. If you would spin up two different instances of Prometheus (which uses the HTTP pull method) then they most likely will not have the same exact data.
Firstly, the timestamp will be different. In the case of Graphite, the timestamp must be encoded inside of the data (it is optional in Prometheus). What is more, the values of the time series will most likely be different since scrapes the majority of the time will not happen at the same time due to the added jitter at the start of the scraping.
In Favor Of Pull: Easier to Encrypt The Traffic
It is very easy to put a TLS terminating reverse proxy in front of an ordinary HTTP server which serves metrics, and we could even use something like letsencrypt to automatically get a certificate if it is a public facing system or a certificate from a private CA that everyone on your intranet trusts. Software like Caddy makes it as easy as it could get.
Yes, it is also possible to use client-side TLS but it is error-prone and adds a lot of clutter to the code base. What would you rather have:
- A simple HTTP server in your code or…
- A client that supports client-side TLS to connect to another server to send your metrics there?
Most people would opt for the first option. The reasons why doing this encryption on the client software is a bad idea are the same why in general doing client-side TLS is bad. For example, you could look at this article on reasons why. Also, this answer by Polynomial on Stackoverflow:
The primary reason is that 95% of internet users have no idea what a client-side certificate is, let alone how to use one. Some users can barely manage to use usernames and passwords, and most still don’t bother with two-factor authentication. It’s also a hassle to install a client certificate on separate devices (desktop, laptop, tablet, smartphone, etc.) for authentication to a single service.
I would argue that more or less the same story applies to us, programmers. And we would also love to move that encryption complexity out of our client code and into a separate server. This is feasible only with the pull-based model.
In Favor Of Push: Easy To Model Shortlived Batch-Jobs
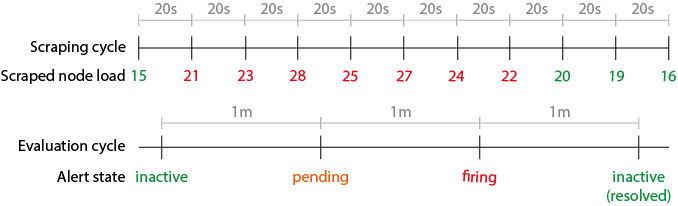
In the push method, the client itself pushes the metrics to the server. On the other hand, in the pull method, the server periodically probes the clients and gathers their metrics. In Prometheus, this is called the scrape period. This has a (painful) result – if the client does not survive for longer than the period, the metrics are lost. This picture explains how the loop works like:
In the push method, we do not have a problem with this since we can send metrics whenever batch-jobs finish. Of course, Prometheus tries to solve this. We have what is called a pushgateway.
Essentially, it is a receiver of metrics that periodically gets scraped by Prometheus a.k.a. Graphite in Prometheus. It also works the same way as graphite-exporter.
However, they have their own problems. For example, metrics might disappear if the push gateway goes down. Or the metric values might get lost if the clients update them faster enough than Prometheus can scrape them.
The push method and Graphite, by extension, does not suffer from this problem.
In Favor Of Pull: Easier To Retrieve Data On Demand (And Debug)
Having a pull method on top of TCP (HTTP) means that it is very easy to retrieve data on demand and debug the problems. Especially, if the metrics data is human-readable and easily understandable like the format used by Prometheus.
This gives you the opportunity to easily distinguish between the errors on the client side and the server side. In the push method, our hands would be kind of tied behind our back because if we were not receiving any metrics then it means one of two things:
- there is something wrong with the network
- there is something wrong with the client
With the push (TCP/HTTP) method, we could easily check between these two by simply going with our web browser to the IP address and port where we could find the metrics data.
If we would get a TCP connection reset then it would mean that the network is OK but there is something wrong with the client. If we would get no response whatsoever then it would mean that something’s wrong with the network. Of course, this depends on the clients sending back a TCP_RST when a port is closed but that’s how the majority of machines act.
In Favor Of Push: Might Potentially Be More Performant
Push methods typically use UDP whereas pull methods are based on TCP (HTTP). What this means is that we could potentially push metrics more performantly than pull them. This is due to the fact that there is way less overhead for managing UDP connections. For example, there is no need to check if the message that you have sent to your peer has been actually received and in the correct order.
However, with TCP support baked into much of the commodity network cards, and operating systems which use the hardware acceleration are everywhere, the overhead is probably not as big as it would have been back in the 90s, for example.
Conclusion
Both of these two models have their pros and cons. However, it seems that the pull-based model won since it offers just a little bit more reliability (especially when talking about very large scale deployments) and that it needs just a bit less number of workarounds to satisfy all of the possible metrics gathering use cases.
It’s probably not without a reason that systems such as Prometheus became very popular which is a descendant of the Borgmon monitoring system. And, as we know, Borgmon was used to monitor the work scheduling system called Borg at Google which later became the system that we all know and love – Kubernetes.