Load Testing Thanos Query (StoreAPI)

Intro

Thanos Query is the component of Thanos that fans out a query to one or more nodes that implement the StoreAPI and then it can deduplicate the results. It also implements the Prometheus API which lets you use it via Grafana.

Any of the other components may be the receivers:

  • Thanos Receive;
  • Thanos Rule;
  • Thanos Sidecar;
  • Thanos Compact;
  • Thanos Query itself.

It is tricky to know how much resources you will need for any given deployment of Thanos Query because it depends on a lot of different criteria. So, to know that and to actually test the limits in practice, you ought to perform what is commonly called a load/stress test. We will use a tool called thanosbench to do that in this tutorial.

Of course, this program is not just limited to Thanos Query. You can stress test any of the other previously components or any other thing that implements the StoreAPI. But we will focus on Thanos Query in this post as that is the focal point where users’ queries come in.

Tutorial

Running thanosbench

To run it, you will need to set up Go on your machine. You can find a tutorial here on how to do it.

To validate whether you have Go installed properly, you can use govalidate. For example, on my machine it shows:

 $ ./govalidate_linux_amd64 
[✔] Go (go1.14.2)
[✔] Checking if $PATH contains "/home/gstatkevicius/go/bin"
[✔] Checking gcc for CGO support
[!] Vim Go plugin
    Vim is installed but cannot determine the Go plugin status.
    See https://github.com/fatih/vim-go to install.
[✔] VSCode Go extension

Of course, depending on your machine’s state, you will see a different output but the most important thing is that Go is installed as you can see on the first line.

Then, we need to clone the source and compile it. For this, you’ll need GNU Make and git on your machine:

$ git clone https://github.com/thanos-io/thanosbench.git
$ cd thanosbench
$ make build

Now you can run thanosbench and see all of the available options:

$ ./thanosbench -h
usage: thanosbench [<flags>] <command> [<args> ...]

Benchmarking tools for Thanos

Flags:
  -h, --help               Show context-sensitive help (also try --help-long and --help-man).
      --version            Show application version.
      --log.level=info     Log filtering level.
      --log.format=logfmt  Log format to use.

Commands:
  help [<command>...]
    Show help.

...

  stress --workers=WORKERS [<flags>] <target>
    Stress tests a remote StoreAPI.

We will use the stress subcommand in the rest of this tutorial. The <target> argument is a pair of an IP address and a port delimited by a colon (‘:’).

How It Works

To find out all of the available flags, run:

./thanosbench stress -h

usage: thanosbench stress --workers=WORKERS [<flags>] <target>

Stress tests a remote StoreAPI.

Flags:
  -h, --help                  Show context-sensitive help (also try --help-long and --help-man).
      --version               Show application version.
      --log.level=info        Log filtering level.
      --log.format=logfmt     Log format to use.
      --workers=WORKERS       Number of go routines for stress testing.
      --timeout=60s           Timeout of each operation
      --query.look-back=300h  How much time into the past at max we should look back

Args:
  <target>  IP:PORT pair of the target to stress.

The way it works is that at first thanosbench asks for all of the available metric names. Then, WORKERS number of goroutines are spawned. All of them are constantly sending Series() calls via gRPC, reading the results, and discarding them. It asks for data that spans anywhere from the current time to the current time minus the time range provided by --query.look-back .

Please note that your Thanos Store might have a sample limit by the way of --store.grpc.series-sample-limit or some other limits might be hit so if any errors occur then I would recommend you to either turn those limits off while you are stress testing Thanos Query or increasing those parameters until you’d hit physical limits. This is because we want to objectively test how much load we can handle at most and increase/decrease the limits after knowing the exact numbers.

Ideally, to test the maximum capabilities of your Thanos Store node, you need to set --query.look-back to the value that is the maximum of your retention times set on Thanos Compactor i.e. max(retention.resolution-raw, retention.resolution-5m, retention.resolution-1h). However, it only asks for raw data at the moment. Generally, you are supposed to have those three retention periods set to the same value so I think this advice is still applicable. We could parameterize this in the future. Pull requests are welcome.

Also, we could improve by spamming calls to other gRPC methods that are exposed by StoreAPI as well such as LabelValues(). But, for the time being only Series() is sufficient because that call generates the most load and that is what users do most of the time.

What’s more, you should most likely set the --timeout parameter to the value of –query.timeout that you have on your Thanos Query node. This helps to mimic the exact thing your users would do in the worst-case i.e. waiting the whole time period until they’d their results.

Things To Look For

Of course, you need to follow the application-specific metrics. For that, I would recommend you to import the dashboards from here.

As you can see in this Thanos Sidecar dashboard, running with even a few workers immediately leads to a huge increase in resource consumption:

Screenshot showing that the test has started i.e. rate of gRPC calls jumped to a couple thousand every second

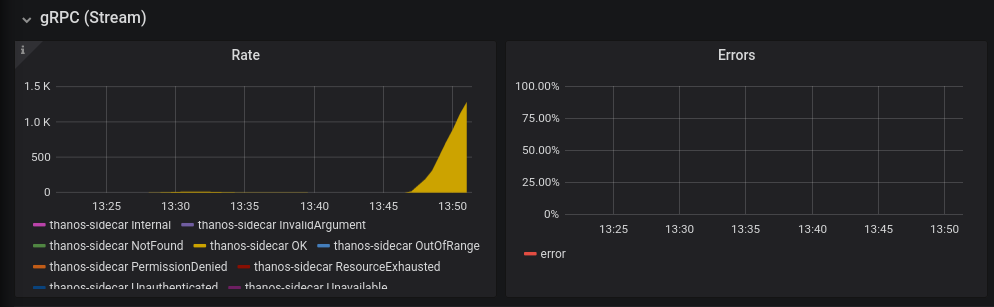
There are the three golden signals you should look out for in those dashboards:

  • Request rate
  • Error rate
  • Duration

All of the ideal values of those metrics are specific to your service level. Obviously, in a perfect world, you should be able to handle as many requests as possible with the least amount of duration and with no errors. Normally, you’d look at the 99th percentile of durations:

Screenshot showing Thanos Sidecar requests p99 on my local computer

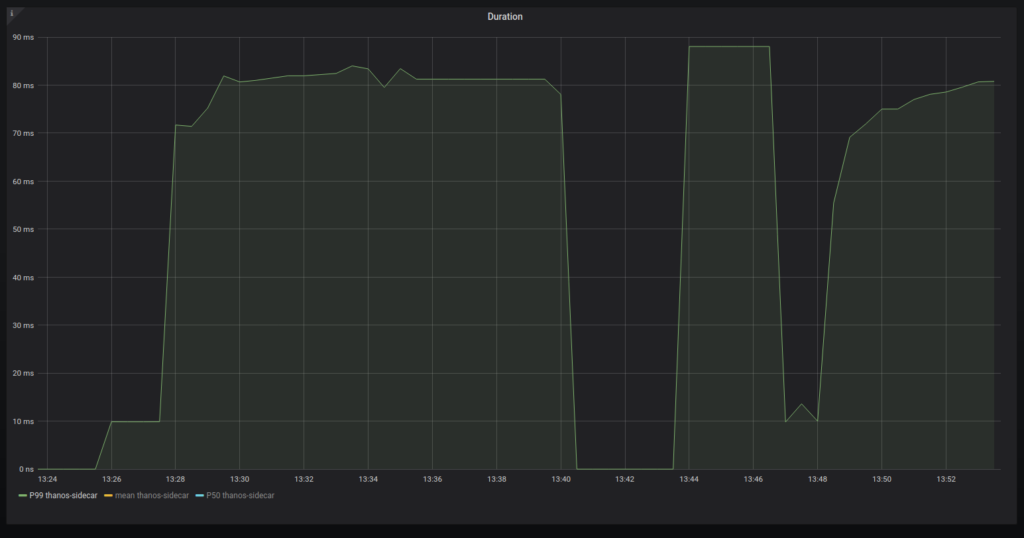
This is a very small duration because I am running it on my own computer.

Also, operating system-level metrics are very important as well. You can get them by installing node_exporter or wmi_exporter with their respective dashboards. RAM consumption should ideally be maximally around 80% to have some margin in case you will want to perform some RAM heavy operations. CPU and other resources are reflected via the latency metrics provided by Thanos.

I think all of the things related to stress testing a live Thanos deployment should be covered by this article. Obviously, improvements are always possible so feel free to open up a pull request on thanosbench and/or comment down below if you notice any issues!

Is it a good idea to use Prometheus for storing ASCII paintings?

In the Cloud-based computing world, a relatively popular free and open-source software product called Prometheus exists which lets you monitor and observe other things. One of the components of its user interface lets you execute ad-hoc queries on the data that it has and see their results – not just in a table but also in a graphical way as well. For example, this is a query time() which plots the current time using two dimensions:

So, this gave me an idea some time ago: why not try to put some ASCII paintings in that interface and see how well Prometheus would be able to store them? And that is what I have done. To test this out, I needed to create a simple HTTP server which would serve the “metrics” which are actually the painting parts.

I have done it using the Rust programming language: additionally I got some experience in dealing with HTTP requests in it since I am still new to it. Lets continue talking about the actual realization of this thing. Note: if you ever have any trouble viewing the images then please right click on them and press View Image.

Implementation detail

Downsides

Immediately, a keen reader would have noticed that you cannot completely map the original ASCII paintings to the Prometheus interface since the characters could take any of the 255 different, possible forms, and we only have lines, albeit they can be with different colors, at our disposal.

However, the colors will be the representation of newline characters in the original painting. Thus, unfortunately, the different characters will have to be transformed into either 1 or 0 or, in other words, either a dot exists – the character is not space – or not.

So, we will inevitably lose some kind of information about the painting so it is a relatively lossy encoding scheme 🙁 But even in the face of it, lets continue on with our fun experiment.

Another thing to consider is the gap between different lines. Prometheus metrics have a floating point value attached to them. We could use 1naively everywhere as the value that we will add to separate two different lines however that will not get us very far ahead since the Prometheus UI automatically adapts the zoom level and the maximum values on the X/Y axis according to the retrieved data. This means that we might still have relatively big gaps even with that.

For that reason, we need to introduce some kind of “compression factor” into our application. Using it, we would be able to “squish” the painting more or “expand” it so that it would encompass more space at the expense of prettiness and recognizability.

Keeping that in mind, lets continue on to a example painting so that we would be able to see how it looks like.

Example

Lets start with the classical Tux penguin:

            .-"""-.
           '       \
          |,.  ,-.  |
          |()L( ()| |
          |,'  `".| |
          |.___.',| `
         .j `--"' `  `.
        / '        '   \
       / /          `   `.
      / /            `    .
     / /              l   |
    . ,               |   |
    ,"`.             .|   |
 _.'   ``.          | `..-'l
|       `.`,        |      `.
|         `.    __.j         )
|__        |--""___|      ,-'
   `"--...,+""""   `._,.-'

Our Prometheus will be configured with the following configuration:

---
global:
    scrape_interval: 1s

scrape_configs:
    - job_name: 'painter'
      static_configs:
      - targets: ['localhost:1234']

I have the scrape interval smaller so that it would take less time to ingest all of the painting into Prometheus. By running cargo run -- --input ./test4 I got the following result:

Our Tux penguin in Prometheus!

Now, lets try to compare the different compression factors and see how they play out in terms of the Prometheus query user interface:

On the left-most side we see the Tux penguin with the default compression factor i.e. 1 is used as the “gap”. In the middle, the Tux penguin became bigger by using compression factor 0.5 i.e. the penguin just became much bigger! However, as you can see, it became much harder to understand that we are still looking at the penguin. Lastly, the one on the right uses compression factor 2 or, in other words, 0.5 is used as the “gap” between lines. The penguin became much more legible in this case!

Lastly, lets try some kind of very big painting to see how well it fares in such situations as well. Try to guess what is this:

Yes, it is a duck! Here is the original ASCII:

                          XXXXXXXXXXXXXXXXXXXXXXX
                     XXXXXXXXXXXXXXXXXXXXXXXXXXXXXXXXX
                  XXXX                                XXXX
              XXXX                                        XXXX
           XXX                                                XXX
         XX                                                      XX
       XX                                                          XX
      XX                                                            XX
     XX                                                              XX
    XX                                                        X       XX
   XX                                                   XX     XX      XX
  XX                                                      XXX    XX     XX
 XX      XX   XX                                             XX         XX
 XX    XX   XX                                                 XX        XX
XX    X    X                                                    XX       XX
XX   X    X                                                               X
X   X    X                                                                X
X       X              8                                 8                X
X                       8                               8                 X
X                  8     8                             8   8              X
X                   8  8  8                           8  8   8            X
X                    8  8  8                         8  8  88             X
X                     8  8  8                       XXXX  8               X
X                      8 XXXX                       XXXXX8                X
XX                      XXXXXX                    XXXXXXXX               XX
XX                     XXXXXXXX                  XXXXXXXXXX              XX
XX                    XXXXXXXXXX                XXXXXXXXXXXX             XX
 XX                  XXXXXXXXXXXX               XXXXXXXXXXXXX           XX
  XX                 XXXXXXXXXXXXX             XXXXXXXXXXXXXX          XX
  XX                XXXXXXXXXXXXXX            XXXXXXXXXXXXXXX          XX
  XX                XXXXXXXXXXXXXX           XXXXXXXXXXXXXXXX          XX
   XX              XXXXXXXXXXXXXXX           XXXXXXXXXXXXXXXX         XX
    XX             XXXXXXXXXXXXXXX           XXXXXXX    XXXXX        XX
     XX            XXXXXXX   XXXXX           XXXXXX      XXXX       XX
     XX            XXXXXX     XXX            XXXXX       XXXX       XX
      XX           XXXXX  88  XXXX           XXXX   88   XXX       XX
      XX           XXXX  8888  XX            XXXX  8888  XXX       XX
       XX          XXXX  8888 XXX            XXXX  8888 XXX       XX
        XX         XXXXX  88 XXX              XXXX  88 XXX       XX
          XX        XXXX    XXX               XXXX    XXX       XX
           XXX       XXXXXXXXX                 XXXXXXXXX       XXX
           XX          XXXXX      XXXXXXXXXXX    XXXXX           XX
          XXX           XX    XXXX           XXX  XX             XXX
          XX                XX XXXXX          XXXXX                XX
          XX               X  XX    XXXX  XXXX  XXXX   XXXX        XX
          XX                    XXX     XX     XX   XXX    X       XX
          XX                       XXX     XXX                    XX
           XX                         XXXXX                     XXX
             XX                                               XXX
              XXXXX                                        XXXX
                   XXXXXXXXXXX                     XXXXXXXX
                              XXXX             XXXX
                                 XX           XX
                                  XX         XX
                                  XX         XX
                                  XX         XX
                                   XX       XX
                                    XX      XX
                                    XX      XX
                                 XXXXX       XXXX
                               XX                XX
                             XX X XX        XX X XX
                            XX  XX             XX XX
                           XX  XX               XX XX
                          XX   XX               XX  XX
                         XX   XX                 XX  XX
                       XX    XX                   XX  XX
                      XX    XX                    XX   XX
                     XX    XX                     XX   XX
                    XX    XX                       XX   XX
                    XX    XX                       XX   XX
                    XX  XX                         XX   XX
                    XX  XX                         XX   XX
                     XX XX                         XX  XX
                      XXXX                         XXXX
                        XX                         XX
                        XX                         XX
                        XX                         XX
                        XX                         XX
                        XX                        XX
                        XX                       XX
                         XX                     XX
                         XX                     XX
                          XX                   XX
                           XX                 XX
                           XX     XXXXX     XX
                            XX  XX     XX  X
                             X  X       X  X
         XXXXXXX             X  X       X  X
   XXXXXX       XXXX         X  X       X  X           XXXXXX
 XXX                XXXXX    X  X       X  X      XXXXX      XXXXXX
XX     XXXX              XXXXX  X       X  X  XXXX                 XXX
X    XX  XX                     X     XXX  XXX              XXX      XX
X   X  XX                       XX   XX                      XXXX     XX
X  X XX                         XX   XX                        XXXX    XX
X X X                        XXXX     XXXX                       X XX   X
XX  X                    XXXX             XXX                     X X   X
XX X                  XXX                    XXX                   X X  X
XX XX               XX                         XXX                 X X  X
     X           XXX                              XX               X X X
      XXXXXXXXXXX                                   XXXX          XXXXX
                                                        XXXXXXXXXX

Taken from ASCIIWorld.

Disk usage comparison

Lets try to compare how much it takes to store the Tux image used before, for example. Also, note that Prometheus by itself stores some “meta” metrics about its internal state such as the metric up which shows what jobs were up and if they were successfully scraped or not.

By itself the Tux painting has 464 bytes of data. I ran Prometheus again and “painted” the ASCII picture there. The end result is that for storing all of it + some meta metrics it takes 10232 bytes of disk space.

Given that it is such a lossy encoding scheme and that it takes ~25 more times to store the same picture of Tux we can safely conclude that it is not a good idea to store our paintings there.

Future

Perhaps we could take this concept even further and write a FUSE filesystem for Linux which would store all of this data in Prometheus? We have all of the needed components: we are able to store ones and zeros, and one other symbol to separate between different “parts”. Plus, this filesystem would also provide a very “futuristic” feature – we would be able to travel back in time to see how the contents of the disk have changed.

On the other hand, spurious network problems could lead to data loss since Prometheus would not be able to scrape all of the metrics. So perhaps this idea should be abandoned after all unless someone wants to do such an experiment.

You can find all of the source code here! Do not hesitate to comment or share this if you have enjoyed it.