Setting custom metric retention periods on Thanos is one of the longest feature requests that we have had: https://github.com/thanos-io/thanos/issues/903. It seems like there is still no solution in sight but actually, it is already possible to have custom metrics retention periods. It is quite a simple idea but could be hard to implement if you do not have comfortable deployment tooling in place. You can achieve custom retention periods for different metrics in the following way:
- Designate
retentionas a special (external) label that controls how long the metrics should be kept i.e. ensure that no metrics have this label - Send metrics with bigger retention over remote write to Thanos Receive instances that have
retentionexternal label set to the retention period - Set up multiple instances of Thanos Compactors with different retention periods and each of them needs to pick up blocks with those respective external labels
- Add
retentionas another deduplication label on Thanos Query
In the end, all of your blocks should have some kind of retention as an external label and then you should have multiple Thanos Compactors for each stream of retention label.
Note that this whole setup assumes that you will not want to change the default retention for a big amount of metrics. I have found it to be true in most of the cases, in my experience. It is just anecdotal data but most of the time you’ll want around 30 – 60 days of retention by default, with some people wanting about a year’s worth of retention if they are doing some kind of analytics on that data e.g. they are trying to predict the number of requests. If you will want to change the retention of a big amount of metrics then this simple setup will not work and you will need to scale the receiving side i.e. the Receivers. But, that is out of the scope of this article.
Also, ideally you would want to avoid having to remote write anything at all and let Sidecar do its work with multiple Prometheus+Sidecar pairs, each having their own retention label. However, it might not be so easy to do for most people who do not have advanced configuration management set up on their systems.
The rest of the article focuses on a hacky way to achieve multiple retention periods for different metrics with the constraint that only one Prometheus node is in the picture.
Here is how this setup looks like in a graphic:
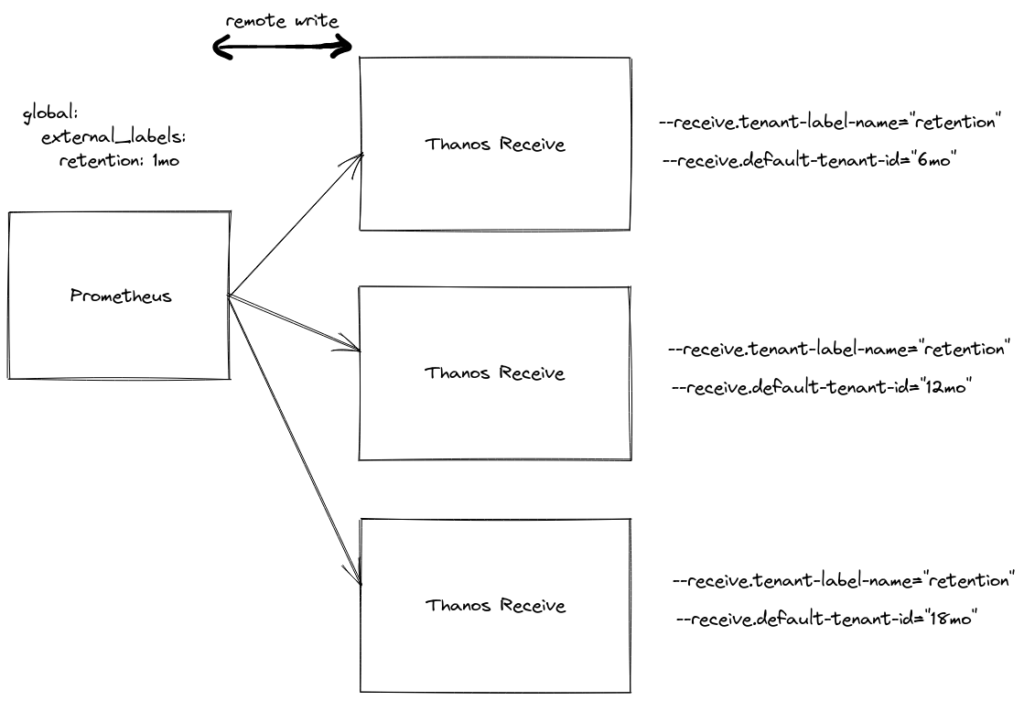
Let’s walk through the most important parts:
- External labels and metric_relabel_config configuration on Prometheus. First, we need to set the label
retentionto a value such as1mowhich will indicate the default retention for metrics. There may be some extra external labels, that does not matter in our case. Do specify that default retention with:
global:
  external_labels:
    retention: 1mo
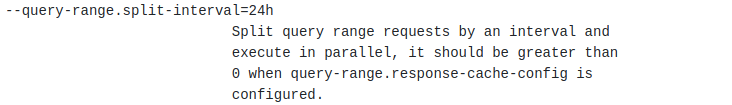
- Set up Thanos Receive with “tenants” such as
12mo:
--receive.tenant-label-name="retention" --receive.default-tenant-id="12mo" --label=...
Add your extra external labels such as fqdn to identify this Thanos Receive node.
- Set up remote writing to Thanos Receive in the Prometheus configuration. For example:
remote_write:
    - url: http://localhost:19291/api/v1/receive
- Edit your Thanos Query to include
retentionas the deduplication label:
query ... --query.replica-label=retention
- Set up multiple Thanos Compactors for each different
retentionwith their own relabel configs. Here is an example for12mo:
    - source_labels:
      - retention
      regex: "12mo"
      action: keep
And then you need to have the respective retention configuration on that Thanos Compactor:
--retention.resolution-1h=365d --retention.resolution-raw=365d --retention.resolution-5m=365d --selector.relabel-config=...
This assumes that there are 365 days in a year.
Repeat this configuration for each different retention external label that you might have.
At this point, all of the metrics are duplicated locally and in remote write with extra retention. Consider following the last point in this post.
- (Optional) Enable metric_relabel_configs on your scraping target(-s) to avoid ingesting metrics with certain label names/values. As an alternative, you can use write_relabel_configs to only keep certain metrics sent to remote write storage that have certain patterns. For example, to only send metrics with label
tenant="Team Very Importantto external storage with12moretention, add the following configuration:
remote_write:
    - url: http://localhost:19291/api/v1/receive
      write_relabel_configs:
      - source_labels: [tenant]
        regex: Team Very Important
        action: keep
You could also work around this problem by having separate scrapers and some external system that feeds targets into your Prometheus according to the set retention with file_sd_configs or some other mechanism as mentioned at the beginning of the article.
As the last alternative, consider using the Prometheus Agent to have minimal storage on disk, and to send everything over remote write to Thanos Receivers.
I hope this helps. Let me know if you have any comments or suggestions!