Intro
Having a monitoring infrastructure is one of the tenets of the DevOps world. And, it seems that Prometheus and all of its extraneous integrations such as Thanos or Uber’s M3DB is taking over that world slowly. They give you a lot of improvements over the old Graphite set-ups such as increased reliability since Prometheus is based on HTTP which uses TCP thus you explicitly know when something goes wrong compared to UDP; it uses a pull based model so you explicitly know when something goes wrong and so on.
Thus, with all of the new users adopting it, a question begs to be asked: how do we properly plan our system’s capacity so that we would withhold all of the possible queries? This is, in general, very important in the DevOps world.
I learned a lot about doing that with Prometheus and Thanos Sidecar over the past few months so let me share with you my insights. Hopefully, you will find this useful.
All of the following thoughts are based on Prometheus 2.4.2 and Thanos 0.1.0. It might and will most likely change in the future version(-s).
I will not mention other things that may not be as important as other things like disk throughput. The majority of modern hardware should be good enough for Prometheus deployments of any size.
Most important components for Prometheus + Thanos Sidecar
CPU
The CPU usage is deeply impacted by the actual content of the PromQL queries that are being executed. To be even more exact, what matters is what kind of (if any) aggregation operators or math functions you are using in the queries. Obviously, functions such as time() do not cost a lot since you only the Unix timestamp of the current time.
Naturally, it follows that functions which use a range vector use more CPU time than those which take an instant vector as you have to iterate over more than 1 value (usually). Obviously, even functions that take instant vectors can be costly such as the sort() function. Also, because it is hard to intercept PromQL queries by their content as they are coming in, it does not make sense to talk much about the different functions but stuff like holt_winters() and quantile_over_time() indeed takes the most time.
This hooks up into the other functionality of Prometheus: it has a concept of alerting rules. They are being periodically evaluated against the data and they transition from pending to firing. Alas, if you do a lot of number crunching in different expressions, you can move the common part to a what is called a “recording rule”. Then, you can use the resulting name in all of the expressions where you need that value. This avoids recalculating the same thing over and over.
As for Thanos Sidecar, this does not impact it whatsoever since it only passes on the results to Thanos Query which actually computes the final results having the (deduplicated) time series data after evaluating the query.
This, in practice, means that for a separate Prometheus + Thanos Sidecar deployment, it does not matter at all what actual queries the user is sending besides the number of time series that they return.
RAM
Roughly, the RAM usage is equivalent to the sum of the:
- resident TSDB size on-disk because Prometheus internally uses
mmap(2)so it is possible that all data that is on disk may be allocated in the memory too (applies only to Prometheus). Note that in this the new metrics ingestion rate is included as well because all new metrics data is added to the WAL which uses the same principle as the rest of the TSDB mechanism; - and buffers used for the responses and requests (applies to both Thanos Sidecar and Prometheus).
The first item is a more static size whereas the second one is more dynamic. The Prometheus options of limiting the amount of concurrent requests and the number of samples that they return through different interfaces comes into play here. Consider limiting them even more if you have a smaller machine after you stress test it and get the results. The most important options are:
- –storage.remote.read-concurrent-limit
- —storage.remote.read-sample-limit
- –query.max-concurrency
- –query.max-samples
Stress testing existing Prometheus set-ups
Such things as prombench and thanosbench already exist which benchmark the Prometheus and Thanos software respectively. However, that software is written with the assumption that the user has an access to some kind of Kubernetes cluster where everything will be performed. Unfortunately, that is not always the case.
To stress test existing setups, you might use features such as the Consul service discovery for Prometheus. Then, you push some fixed amount of data into it and query it through Thanos Sidecar. That way all of the parts of the system will be tested – the remote read interface, ingestion, and so on.
It might look like this:
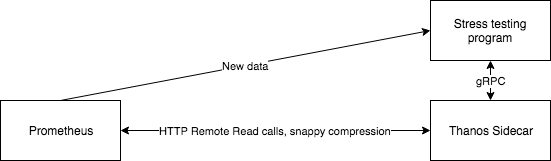
This is a simplified view, obviously. Consider using Consul service discovery or some other mechanism to discover the machine that is running the tests. It will make your life much easier.
Re-use pushgateways
The race conditions between the scrapes and the HTTP server is inherent so re-use PushGateway to make life easier. Yes, starting your own HTTP server reduces the likelihood of a race but still, it is possible thus it does not solve the problem completely. On the other hand, it is more efficient because you only have to have one copy of the data on the wire. But it makes your code more cumbersome so decide for yourself. I recommend starting by using a PushGateway and only then if it becomes unbearable, switch to running an HTTP server with metrics yourself.
If you are making your own stress testing program in Golang, consider using the net/http package because it does the job and you most likely do not need anything fancy.
Use a sliding window
Use a sliding window to be able to specify max samples per q.
As the maximum amount of samples returned per query makes the biggest impact, you must limit the amount of samples returned somehow. After a bit of thinking and testing, it seems to me that using a “sliding window” technique leads to the best results generally – the code looks clean and it is understandable. The method is essentially this:
- continue pushing metrics from time X;
- at each point Y, limit the query to the time range from X to Y. If needed, push the beginning of the “time window” so that only a fixed amount of samples would be covered.
This is all made possible by knowing the scrape interval. Add it as a parameter to your program. By knowing that, you can divide the amount of time that has passed since the beginning by it and know how many samples have been pushed of Z amount of time series.
Divide the work
If you are feeling extra fancy or you do not have a single machine that has a lot of threads of execution for all the work, consider dividing the work over a lot of nodes.
For this use-case, you could use libraries such as SCOOP. I do not have any particular recommendations here as it depends on what language you are writing your capacity planning (stress testing) program in.
Check the results
Make it an option to either check or not the results of all of the queries that your program is making. Clearly, the program might start dealing with a lot of data and it might not make sense checking all of the data returned since it can easily take lots of CPU time, and thus the quality of your data will drastically drop.
Imagine having 20 concurrent queriers, each of them dealing with 500000 samples. You would have to deal with a lot of data. This is especially true for bigger organizations. If that is disabled then, honestly, just check if you got the required amount of time series and you successfully retrieved a correct amount of samples. But, do not check the exact data if the user explicitly disabled it.
Miscellaneous pain points
Thanos Store sample limit
This is a bit unrelated but the Thanos Store component of the whole Thanos system does not, unfortunately, provide a way to limit the number of samples returned per each query. This means that practically some query could knock down all of your systems if it will request a lot of data.
For example, imagine someone sending a query like {__name__=~".*"}. This would retrieve all of the data, technically, as each metric has a special label called __name__which contains the name of the metric itself. Thus, it would match everything. This is orthogonal to the whole long-term storage approach where each query is supposed to only query a small piece of data from the supporting storage and not the whole database.
Hopefully, this will be remediated in the near future or maybe I will work on it if I will have the time.
Remote read API inefficiency
Remote read API is highly inefficient which is used by the Thanos project. It is a one-shot API i.e. the whole response is prepared at once and sent back to the client. This means that you will have a couple of buffers with the same data, essentially. At the minimum, you will need three buffers – one for the query results, one for the results in the API response format, one for the results in the API response format and compressed with snappy.
Luckily, this will change in a version of Prometheus in the near future. A lot of work is being done in this part since the pain can be felt by a lot of people. Thanos folk are helping to drive this process forward too – they even had a discussion about it at the Prometheus developer summit.
As always, happy hacking! Let me know if you have any comments or if you have spotted any issues.